Funnel
 Some of the options mentioned in this document are being released in a phased manner and may only be available to specific users.
 The Dashboards tab is renamed as Analytics for selected accounts.
A funnel segregates the data based on different stages involved in your business process. For instance, a sales funnel can give you details like particular sales stages that you should concentrate on, stage-wise drop rate in lead conversion process, number of leads/prospects at each stage, etc. Information like this can help you readily plan your upcoming sales activities.
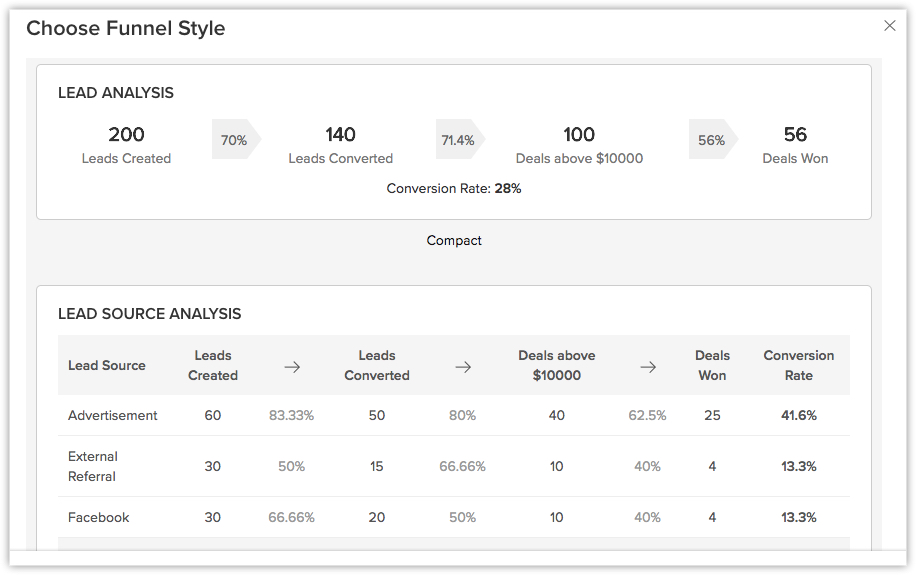
Based on your business requirement, you can choose from 5 different types of funnels:
- Standard
- Compact
- Segment
- Classic
- Path
To create a funnel
- Click the Dashboards tab.
- In the Dashboard Builder page, select the dashboard in which the Funnel has to be added.
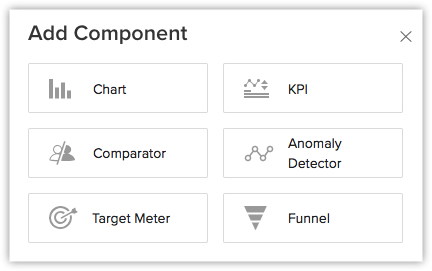
- Click Add Component.
- In the Add Component page, click the Funnel.

- In the Choose Funnel style page, click the desired funnel style.

- In the next page, do the following:
- Enter the Component name.
- In Build Your Funnel click Stage 1.
- Enter the Stage name.
- Select a Module and Duration from the drop-down list.
- Click Criteria Filter to further specify the criteria for filtering records.
You can add up to 10 criteria. - Click Done.
- Click Add Stage, to add the subsequent stages.
- If you want large numbers to be displayed in a shortened format, enable Display as shortened numbers. Set the format and select the decimal places.
- Click Save.

Note
- You can Clone, Edit, Delete, Print, Add to Home, Embed URL or Add a chart to favourite by clicking on the More icon in the component.
- When you enable Display as shortened numbers, you can choose the format (for example, display thousands as K) and decimal places. If you've chosen the format as Millions (M) and decimal places as 2, the number 135,532,000 will be displayed as 135.53 M.
- Supported formats are:
Thousands (K)
Millions (M)
Billions (B)
Lakhs (L)
Crores (C) - Number of decimal places supported are: 0, 1, 2, and 3.
- Along with viewing unconverted leads, you can also view converted leads based on analytical components from the Leads module. Utilize the "Is Converted" field in the filters to display both converted and unconverted leads with the criteria "Is Converted is Selected" and "Is Converted is Not Selected" respectively.
- For date/time, currency, number-related, roll-up summaries, and checkbox fields: You can filter records either based on specific values or by comparing with a similar field.
Related Articles
Analytical Components - Overview
Zoho CRM provides different types of analytics components for user dashboards. The list of components that the users can choose from is: Charts - Chart is a graphic representation of the user's data. It gives quick insights into records for easy ...Recycle Bin
All the records and files that are deleted from the Zoho CRM account will be stored in the recycle bin. You can restore the records from the recycle bin within 60 days, after which they will be permanently deleted from your CRM account. You can also ...Data Analytics - An Overview
Zoho CRM enables fully customizable reports in all the modules with flexible options, such as cross-linking modules, 3-level column grouping, scheduling reports generation and delivering to the intended users including non-Zoho CRM users through ...Marketing Attribution
Why do Businesses Need Marketing Attribution? Marketing campaigns play a crucial role in any business, as they help one ensure a better consumer reach and awareness. Most companies prefer integrated campaigns since multiple channels ascertain much ...FAQs: Chart View
CRM for Everyone is in the Restricted Early Access mode and is available only to a select set of users upon request. Request access to gain hands-on experience with this new version. What is a Chart view in Zoho CRM? Chart view presents data visually ...