Key Performance Indicators (KPIs)
 Some of the options mentioned in this document are being released in a phased manner and may only be available to specific users.
 The Dashboards tab is renamed as Analytics for selected accounts.
Key Performance Indicator (KPI) is a standard measurement that demonstrates the effectiveness of your sales team in achieving important business objectives, it also gives useful analytics to help sales personnel increase their productivity by measuring their performance on a regular basis. For example, a sales manager wants to monitor the top 10 sales reps in terms of average annual revenue each of them have achieved. He can easily accomplish this by creating a ranking style KPI by defining the average annual revenue as the KPI metric.
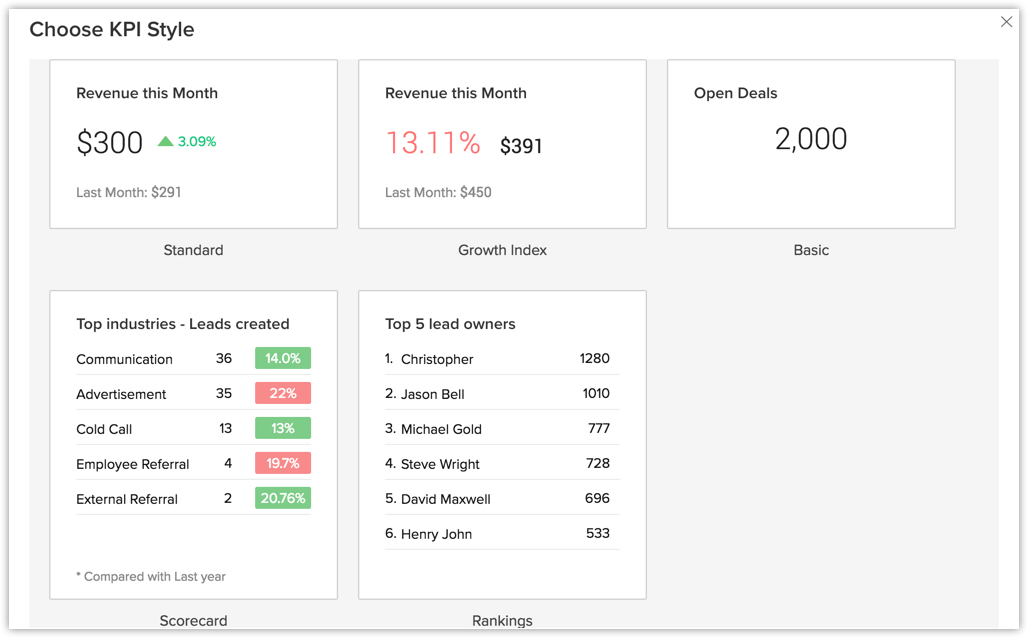
Based on your industry requirement, you can choose from five different types of KPI styles:
- Standard
- Growth Index
- Basic
- Scorecard
- Rankings - Data can be ranked by day, calendar week, fiscal week, month, fiscal quarter, and year.
Create a KPI
To create a KPI
- Click the Dashboards tab.
- In the Dashboard Bulider page, select the dashboard to which the KPI has to be added.
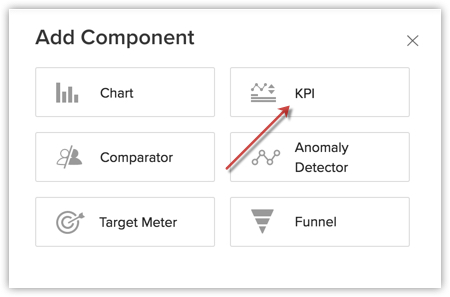
- Click Add Component.
- In the Add Component page, select KPI.

- In the Choose KPI Style page, select a KPI style.

- In the next page, do the following:
- Enter the component name.
- Select a KPI metric and Related module from the drop-down list.
- You can choose a KPI metric other than Count of [Module] and decide whether to display the record count along with that metric by checking the Display Record Count checkbox. The record count will be displayed for both the current duration and the comparison measure if the checkbox is enabled.
- Click Criteria Filter to further specify the criteria for filtering records.
You can configure up to 10 criteria. - Select Duration from the drop down list.
You can choose the duration from week, year, month, quarter, last date, custom date, fiscal week, - In the Comparison Indicator choose the Comparison Metrics and Objective from the drop-down list.
- If you want large numbers to be displayed in a shortened format, enable Display as shortened numbers. Set the format and select the decimal places.
- If you want to group them by certain ranking method, select the appropriate options in the Ranking drop-down list.
Note that this option is available only for Scorecard and Rankings KPI style.
- Enter the component name.
- Click Save.
- Click Add & Reorder to add and rearrange the KPI in a dashboard.

Note
- You can Clone, Edit, Delete, Print, Add to Home, Embed URL or Add a chart to your favourite by clicking on the More icon in the component.
- When you enable Display as shortened numbers, you can choose the format (for example, display thousands as K) and decimal places. If you've chosen the format as Millions (M) and decimal places as 2, the number 135,532,000 will be displayed as 135.53 M.
- Supported formats are:
Thousands (K)
Millions (M)
Billions (B)
Lakhs (L)
Crores (C) - Number of decimal places supported are: 0, 1, 2, and 3.
- Along with viewing unconverted leads, you can also view converted leads based on analytical components from the Leads module. Utilize the "Is Converted" field in the filters to display both converted and unconverted leads with the criteria "Is Converted is Selected" and "Is Converted is Not Selected" respectively.
- For date/time, currency, number-related, roll-up summaries, and checkbox fields: You can filter records either based on specific values or by comparing with a similar field.
Zia's Suggestions for KPIs
Zia will analyze your data and provide the most appropriate recommendations for creating KPI components, suitable for your organization's needs and business processes.
Upon choosing a suggestion, you can modify the configuration if needed or go with the suggested configuration for creating the KPI component.
Related Articles
Analytical Components - Overview
Zoho CRM provides different types of analytics components for user dashboards. The list of components that the users can choose from is: Charts - Chart is a graphic representation of the user's data. It gives quick insights into records for easy ...Motivator for Zoho CRM - Overview
Sales is a fast-paced, high-pressure environment which keeps salespeople always on their toes. The constant pressure and unpredictable nature of working with customers can easily cause a burnout. Even the most highly trained and qualified salesperson ...Zia for Emails — Overview and Key Capabilities
Most business communication and transactions happen over emails, be it with customers, prospects, partners or vendors. Besides being an essential mode for communication, emails are an official repository for important information details on meeting ...What is the key difference between workflow rule for the Calls module and adding Call as an action in a workflow rule?
Creating a workflow automation for the Calls module is for efficient call management within CRM — this will automatically perform actions whenever a call is received, made, missed, or scheduled. This significantly reduces the manual effort required ...Configuring Motivator for Zoho CRM
Motivator for Zoho CRM To access Motivator for Zoho CRM Go to Setup > General > Motivator. Click Access Motivator. You will be redirected to the Motivator for Zoho CRM Home Page in the new tab. Motivator for Zoho CRM can also be accessed from the ...